February 18, 2016
In FIMECC MANU program, manufacturing dashboards showing the most important information at one glance were designed and developed to monitor and control organisation’s performance at different operational levels. Dashboards reduce the gap between the humans and systems by turning data collected from processes and machines into Key Performance Indicators presented in visual format.
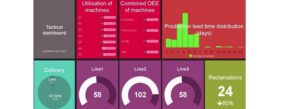
A dashboard is a single page, easy-to-read, real-time user interface, with graphic representations of the current status and historical trends of an organisation’s Key Performance Indicators (KPIs). The role of the dashboard is to enable instantaneous and informed decisions to be made at a glance. To serve their purpose, dashboards must display a dense array of information in a manner that can be quickly examined and understood. This needs solid understanding of visual perception and human cognition—what works, what doesn’t and why. The understanding of different users and their needs are also crucial.
In the FIMECC MANU program, Key Performance Indicators for different key users and the visual appearance of dashboards were investigated. As a result, four LeanMES concept dashboards, which deliver Key Performance Indicators and important data to operative executives in a visual, understandable format on operational, tactical and strategical levels, were created. LeanMES dashboards enable faster reactions to changes and disturbances and right decisions by delivering accurate information to right users in right format.
For example, a strategic dashboard is used by executives and offers quick overview on the health of the business including major high-level measures such as productivity levels, inventory levels, and demand forecasts. Similarly, an operational dashboard is designed to monitor single operations including detailed, real-time data, such as job queues and machines status, and supporting alerting for critical events. Click the video below to take a closer look at LeanMES concept dashboards!
Successful companies are first and foremost informed companies, who base their business decisions on facts instead of assumptions. To make effective decisions accurate, real-time data and information in the form of supportive decision-making are needed. Dashboards combine, arrange and visualise data, metrics and numbers on a single screen eliminating clutter and enabling the viewer can grasp the information being relayed.
Dashboards are highly-visual tools including graphs, charts, and other visually-enhanced features summarising important data and information. Because the viewer can grasp the concept of the information relayed quickly, dashboards effectively improve the accuracy and speed of decision making improving the overall performance of the organisation. Moreover, by enabling the quick decisions at one glance, dashboards even improve productivity levels.
So, what are the benefits of using dashboards in monitoring and controlling? Through dashboards, data collected from the processes and machines is turned into relevance Key Performance Indicators and visualized to the operators and managers. The benefits of using digital dashboards include:
- ability to make more informed decisions based on collected data
- ability to identify and correct negative trends
- improved efficiency and accuracy of decision-making with facts
- ability to determine goals and strategies as a whole
- improved understanding of the cause-effect chain
- possibility for continuous improvement
- improved motivation and worked inclusion
